Ielts Academic Writing Task 1 Sample 49
You should spend a maximum of 20 minutes on this task. Write about the following topic:
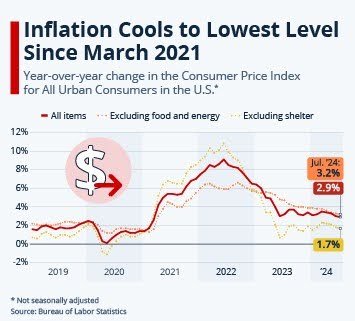
The image provides information about the year-over-year change in the Consumer Price Index for All Urban Consumers in the U.S.

Summarize the information by selecting and reporting the main features, and make comparisons where relevant.
You should write at least 150 words.
The graph shows the year-over-year changes in the Consumer Price Index (CPI) for all urban consumers in the United States from 2019 to 2024, presenting three distinct measures: all items, excluding food and energy, and excluding shelter.
All three indicators demonstrate relatively stable inflation rates around 2% from 2019 to early 2021. However, a significant inflationary surge begins in 2021, with the all-items CPI peaking at approximately 9% in mid-2022. The measures excluding food and energy, and excluding shelter, also increase but to lesser extents, reaching maxima of about 6% and 7% respectively.
Following the 2022 peak, all three indices exhibit a downward trend. By July 2024, the all-items CPI decreases to 3.2%, while the index excluding food and energy settles at 2.9%. The measure excluding shelter shows the most substantial decline, reaching 1.7%.
The divergence between these indices, particularly the lower rate for the measure excluding shelter, suggests that housing costs have been a significant contributor to overall inflation during this period. The data indicates a cooling of inflation to its lowest level since March 2021, with varying rates of decline across different components of the consumer price basket.