Ielts Academic Writing Task 1 Sample 88
You should spend a maximum of 20 minutes on this task. Write about the following topic:
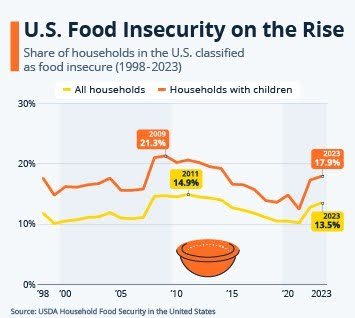
The image provides information about the share of households in the U.S. by food security status (1998-2023).

Summarize the information by selecting and reporting the main features, and make comparisons where relevant.
You should write at least 150 words.
The line graph shows the proportion of U.S. households classified as food insecure from 1998 to 2023, with a distinction between all households and those with children. Food insecurity refers to limited or uncertain access to adequate food.
In 1998, 11.9% of all U.S. households were food insecure, while 17.6% of households with children faced similar conditions. Food insecurity levels fluctuated over time, peaking in 2009 at 21.3% for households with children and 14.7% for all households, coinciding with the global financial crisis. A notable decrease occurred by 2011, with food insecurity among all households reaching 14.9%, but a gradual rise followed.
By 2023, the percentage of food-insecure households increased again, reaching 17.9% for those with children and 13.5% for all households, reflecting a significant rise from earlier years, particularly since the COVID-19 pandemic.
Overall, households with children consistently experience higher rates of food insecurity than the general population. The trend indicates periodic rises, likely influenced by economic crises, and recent data reveals an upward trajectory in food insecurity in the United States.