Ielts Academic Writing Task 1 Sample 105
You should spend a maximum of 20 minutes on this task. Write about the following topic:
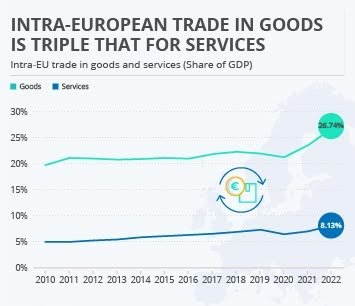
The image provides information about the intra-European trade in goods and services as a share of GDP.

Summarize the information by selecting and reporting the main features, and make comparisons where relevant.
You should write at least 150 words.
The line graph shows intra-European Union trade in goods and services as a percentage of GDP from 2010 to 2022. Throughout the period, goods trade consistently accounts for a substantially larger share of GDP compared to services trade, with goods reaching 26.7% and services 8.13% in 2022.
Goods trade remained relatively stable between 20% and 22% from 2010 to 2020, with a slight decline in 2020 followed by a sharp increase in 2021 and 2022. Services trade exhibited a gradual but steady upward trend, rising from approximately 5% in 2010 to 8.13% in 2022, with a minor decrease in 2020.
The disparity between goods and services trade widened significantly in 2021 and 2022, primarily due to the accelerated growth in goods trade. This divergence underscores the continued dominance of goods in intra-EU trade despite the growth in services.
The data indicates an overall expansion of intra-EU trade relative to GDP, with goods trade demonstrating more pronounced growth and volatility compared to the steadier increase in services trade.