Ielts Academic Writing Task 1 Sample 108
You should spend a maximum of 20 minutes on this task. Write about the following topic:
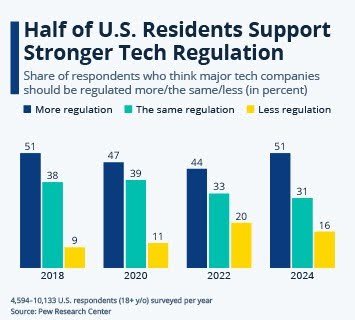
The image provides information about the share of respondents who think major tech companies should be regulated more/the same/less.

Summarize the information by selecting and reporting the main features, and make comparisons where relevant.
You should write at least 150 words.
The bar graph shows the evolving attitudes of U.S. residents toward the regulation of major tech companies from 2018 to 2024. The data is presented as percentages, categorizing respondents’ views into three groups: those favoring more regulation, the same level of regulation, or less regulation.
A consistent majority supports increased tech regulation throughout the period. This preference peaked at 51% in both 2018 and 2024, with a slight dip to 47% in 2020 and 44% in 2022. Conversely, support for maintaining current regulatory levels has declined steadily, from 38% in 2018 to 31% in 2024.
The proportion advocating for reduced regulation, while remaining the smallest group, has grown from 9% in 2018 to 16% in 2024, peaking at 20% in 2022. This trend suggests a gradual polarization of public opinion on tech regulation.
The data shows a persistent inclination towards stronger oversight of tech companies among U.S. residents, coupled with a decreasing preference for maintaining the status quo and a small but notable increase in support for deregulation.