Ielts Academic Writing Task 1 Sample 65
You should spend a maximum of 20 minutes on this task. Write about the following topic:
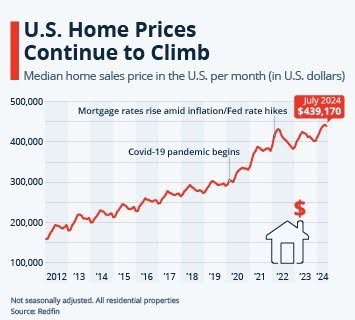
The image provides information about the median home sales price in the U.S. per month (in U.S. dollars).

Summarize the information by selecting and reporting the main features, and make comparisons where relevant.
You should write at least 150 words.
The graph shows the trajectory of median home sales prices in the United States from 2012 to 2024, measured in U.S. dollars per month.
From 2012 to early 2020, the data exhibits a steady upward trend, with prices rising from approximately $200,000 to $300,000. This period is characterized by consistent, gradual growth in home values.
A significant inflection point occurs in 2020, coinciding with the onset of the COVID-19 pandemic. Following this event, home prices demonstrate a steep and accelerated increase, surging from around $300,000 to nearly $450,000 by mid-2022.
The graph indicates a brief plateau in price growth during late 2022, followed by a slight decline. However, prices resume their upward trajectory, reaching a peak of $439,173 in July 2024. This latest data point underscores the continued appreciation of U.S. home values, despite economic fluctuations and policy changes such as mortgage rate increases amid inflationary pressures.
Overall, the graph shows a dramatic escalation in U.S. home prices over the 12-year period, with the most pronounced growth occurring in the post-pandemic era.