Ielts Academic Writing Task 1 Sample 41
You should spend a maximum of 20 minutes on this task. Write about the following topic:
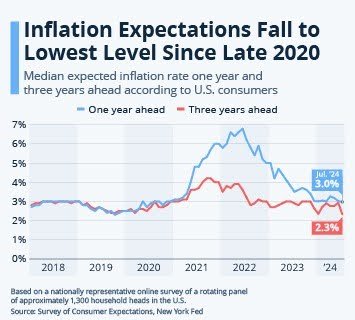
The image provides information about the median expected inflation rate for one year and three years ahead according to U.S. consumers.

Summarize the information by selecting and reporting the main features, and make comparisons where relevant.
You should write at least 150 words.
The line graph illustrates the median inflation expectations in the United States from 2018 to early 2024, comparing one-year and three-year ahead projections according to U.S. consumer surveys.
Between 2018 and 2020, both one-year and three-year expectations remained relatively stable, fluctuating around 3%. However, from late 2020, the metrics began to diverge significantly, with both indicators showing upward trajectories. The three-year expectation reached its peak at approximately 6% in 2022, while the one-year expectation maintained a more moderate increase to about 4%.
From mid-2022, both metrics exhibited a declining trend, with the three-year expectation decreasing more rapidly than the one-year projection. By early 2024, the one-year expectation had fallen to 2.3%, while the three-year expectation settled at 3.0%, representing the lowest levels observed since late 2020.
The convergence of these indicators by 2024 suggests a reduction in the disparity between short-term and medium-term inflation expectations among U.S. consumers, returning to levels more aligned with pre-2021 patterns.