Ielts Academic Writing Task 1 Sample 42
You should spend a maximum of 20 minutes on this task. Write about the following topic:
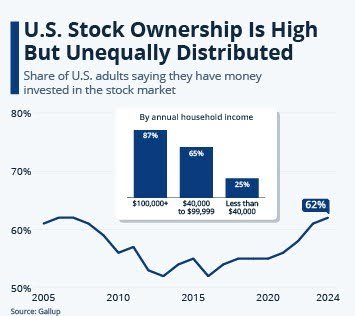
The image provides information about the share of Americans who are invested in the stock market.

Summarize the information by selecting and reporting the main features, and make comparisons where relevant.
You should write at least 150 words.
The data presents an analysis of stock market participation among U.S. adults across different income brackets and its temporal evolution from 2005 to 2024. The graph illustrates two distinct components: a longitudinal trend of overall stock ownership and a distribution breakdown by household income.
Current stock ownership rates demonstrate significant disparities across income segments. Households earning $100,000+ annually exhibit the highest participation rate at 89%, followed by those in the $40,000-$99,999 bracket at 69%. In contrast, households earning less than $40,000 show markedly lower participation at 25%, highlighting substantial wealth-based disparities in market participation.
The temporal trend line reveals notable fluctuations in overall stock ownership between 2005 and 2024. Following a decline and period of relative stability between 2010 and 2015, stock market participation has shown a consistent upward trajectory since 2015. The latest data point indicates approximately 62% of U.S. adults maintain stock market investments as of 2024.
The data emphasizes the correlation between household income and stock market participation, while simultaneously demonstrating an overall increase in market participation across the general population in recent years.