Ielts Academic Writing Task 1 Sample 51
You should spend a maximum of 20 minutes on this task. Write about the following topic:
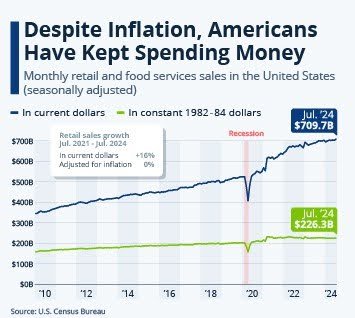
The image provides information about the monthly retail and food services sales in the U.S. since 2010.

Summarize the information by selecting and reporting the main features, and make comparisons where relevant.
You should write at least 150 words.
The graph shows monthly retail and food services sales in the United States from 2010 to 2024, presented in both current and constant 1982-84 dollars. The data is seasonally adjusted to account for cyclical variations.
Sales in current dollars demonstrate a consistent upward trend throughout the period, rising from approximately $300 billion in 2010 to $709.71 billion by July 2024. This represents a significant nominal increase in consumer spending over the 14-year span.
In contrast, sales adjusted for inflation (constant 1982-84 dollars) show a more moderate growth trajectory. Starting at around $150 billion in 2010, inflation-adjusted sales reached $226.38 billion by July 2024, indicating real growth in consumer spending, albeit at a slower pace than nominal figures suggest.
A notable disruption in both trend lines occurs in early 2020, coinciding with the onset of the COVID-19 pandemic, marked as a recession period. Following this brief but sharp decline, both nominal and real sales rebounded rapidly, surpassing pre-pandemic levels and continuing their upward trajectories.