Ielts Academic Writing Task 1 Sample 77
You should spend a maximum of 20 minutes on this task. Write about the following topic:
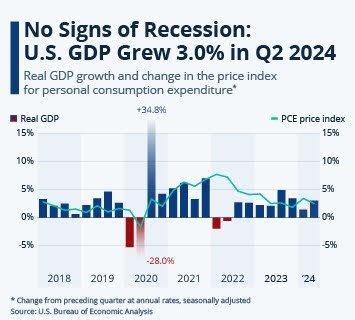
The image provides information about the quarterly change in real GDP and the price index for personal consumption expenditure in the U.S.

Summarize the information by selecting and reporting the main features, and make comparisons where relevant.
You should write at least 150 words.
The graph provides an overview of the U.S. GDP growth and changes in the personal consumption expenditure (PCE) price index from 2018 to the second quarter of 2024. It highlights trends in real GDP and inflation-related metrics.
Between 2018 and 2019, the U.S. experienced stable GDP growth, fluctuating between 1% and 5%. However, in 2020, a significant downturn occurred, with real GDP declining by 28% during the height of the COVID-19 pandemic. This sharp contraction was followed by a notable recovery, with GDP surging by 34.8% in 2021, driven by stimulus measures and reopening of economic sectors.
From 2021 onwards, growth remained relatively stable but subdued compared to the volatile pandemic period, maintaining levels between 0% and 5%. In Q2 2024, the U.S. economy grew by 3.0%, demonstrating resilience.
The PCE price index shows steady increases from 2018 to 2024, indicating gradual inflation. Although both indicators exhibit fluctuations, the overall trend indicates recovery and stability in GDP alongside moderate inflation over the period examined.