Ielts Academic Writing Task Sample 4
You should spend about 20 minutes on this task.
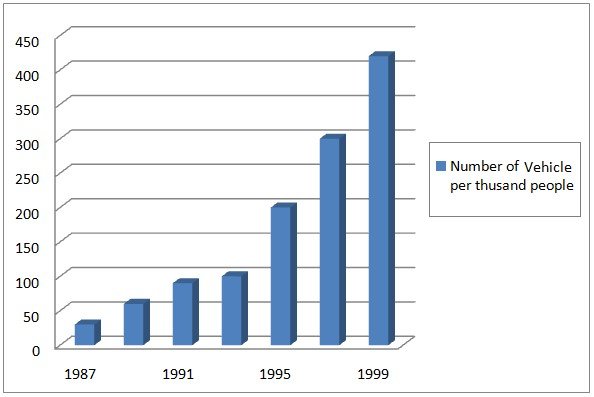
The bar chart below gives information about vehicle ownership in China.
Write a report for a university lecturer describing the information.
You should write at least 150 words.
The bar graph illustrates the number of automobile owners per thousand people in China over a 13-year period, from 1987 to 1999. Upon initial analysis of the statistical data, it is evident that car ownership in China was relatively low in the late 1980s but experienced a significant increase over time.
To begin with, the data reveals that in 1987, only 30 vehicles were owned per one thousand Chinese people. Within a span of two years, this number rose to over 50. Subsequently, the rate of car ownership continued to steadily and rapidly increase, reaching just below 100 by 1993. Furthermore, in 1995, the ownership count surpassed 100 and doubled within the following four years.
Moving forward, a notable comparison can be made with the year 1997, where the number of automobile owners reached just below 300 per one thousand people. Interestingly, this figure more than doubled in a mere four years, from 1995 to 1999. Ultimately, in the final year of the recorded data, over 400 vehicles were owned per one thousand Chinese individuals, representing a significant increase compared to the ownership count in 1987.
Overall, the bar graph clearly illustrates the remarkable growth in car ownership in China over the specified 13-year period, indicating a substantial shift in automobile ownership trends within the country.