Ielts Academic Writing Task Sample 5
You should spend a maximum of 20 minutes on this task. Write about the following topic:
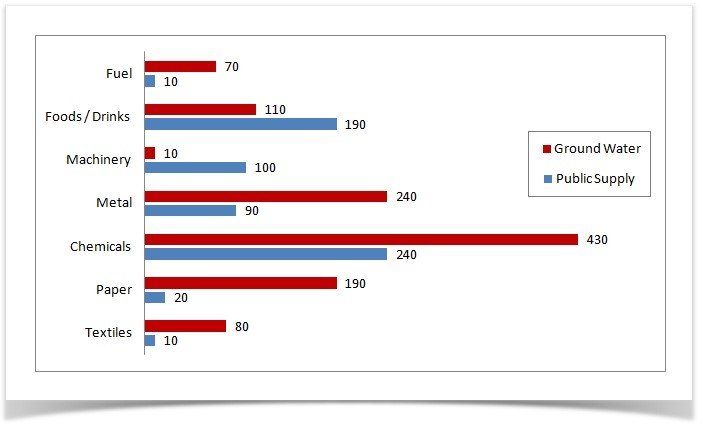
The graph below shows usual water usage (in millions of cubic meters) by industries in some countries in a year.
Summarize the information by selecting and reporting the main features, and make comparisons where relevant.
You should write at least 150 words.
The bar graph illustrates water usage by various industries in selected countries, with data measured in millions of cubic meters, except for groundwater.
It is evident that the chemical industry stands out as the largest consumer of groundwater and water from public supplies, accounting for 430 and 240 million cubic meters, respectively.
There is a 50 million cubic meter disparity between the consumption of ground and public water by metal and paper factories. Additionally, the usage of water in machinery, fuel, textile, and food/drink industries ranges from 10 to 110 million cubic meters.
Further analysis reveals that the fuel and textile industries, along with the paper industry, utilize the lowest amount of water provided by the public supply, with the paper industry consuming 10 million cubic meters more than the other two sectors. Notably, the machinery manufacturing sector consumes precisely 100 million cubic meters, representing a notable difference compared to the food/drink and metal industries.
Overall the chemical industry shows the highest water usage across both groundwater and public supply categories, while the fuel industry exhibits the lowest consumption.